Using Fans to Reduce Heat Stress in Manufacturing Environments
Authors: Charlie Huizenga1*, Hui Zhang1, James Smallcombe2, Junmeng Lyu1, Jiake Yang1, Chang Liu1, Ying Jiang1, Kevin Kim1, Glenda Anderson2, Raagavi Mani3, Ollie Jay2, Stefano Schiavon1, Edward Arens1
* Corresponding author: huizenga@berkeley.edu
1 University of California, Berkeley, USA
2 Heat and Health Research Centre, University of Sydney, Australia
3 National University of Singapore, Singapore
Presented at the Comfort at the Extremes (CATE) Conference, Tucson, Arizona, USA, 27–29 May 2026.
Abstract
Industrial workers in hot and humid environments are vulnerable to heat stress, especially in facilities where mechanical cooling can be expensive and/or impractical to install and operate. We assessed whether air movement from fans can effectively reduce heat strain and improve thermal comfort in an un-airconditioned manufacturing facility in Baton Rouge, Louisiana, USA. Over six weeks, thirty workers were monitored under alternating fan-on and fan-off conditions. Physiological, environmental, and survey data were collected to evaluate comfort, perceived performance, thermal stress and physiological strain. Results show that fans significantly reduced discomfort and the level of perceived effort equivalent to a 5°C reduction in temperature. All the workers stated that having fans in the workplace was important to them and 79% felt that they were more effective at their job with the fans running. Sublingual temperature, heart rate and sweat rate increased with ambient temperature, but did not differ with or without the electric fans. These findings show that air movement offers a low-cost, energy-efficient and effective strategy to mitigate worker discomfort and perceived level of effort and it does not worsen physiological indicators of heat stress in hot manufacturing environments.
Keywords: Heat stress, fans, productivity, occupational heat, manufacturing
1. Introduction
Industrial workers in hot and humid environments are vulnerable to heat stress, which can lead to loss in productivity and reduced work capacity. In facilities where mechanical cooling would be expensive and/or impractical to install and operate, electric fans can be used to cool people as a low cost and energy efficient alternative to air conditioning.
Fans cool people directly via air movement, which under most typical environmental conditions increases both convective dry heat loss and latent heat loss via increased evaporation of sweat. As ambient temperatures approach skin/clothing temperature (~35°C), convective dry heat exchange becomes minimal and evaporation of sweat becomes the dominant means of heat loss. Several studies have demonstrated that fans reduce physiological heat strain for people at rest even at temperatures in the range of 39–43°C depending on humidity and the age and health conditions of the occupants (Jay et al., 2021; Morris et al., 2019; Ravanelli et al., 2015; Mihalcin et al., 2025). This research has led the WHO (WHO 2024) to recently change its guidelines to recognize the benefit of using fans up to 40°C. However, many international guidelines (EPA 2025, UK NHS 2024, OSHA 2022) still recommend the use of fans only up to 35°C, essentially not considering the evaporative heat loss benefits of fans above that temperature. The threshold is set at 32°C by the US Centre for Disease Control (CDC 2012). Our group (CBE and the University of Sydney) has created a publicly available online physiological heat strain tool (Tartarini et al., 2021) as a resource for those interested in this topic. In very dry conditions (e.g., RH < 20%), fans may not be beneficial because sweat completely evaporates in such conditions even without additional air movement so convective sensible heat gain dominates the fan impact. In all hot environments, staying well-hydrated is important due to high fluid loss from sweating. Some researchers have cautioned that the effects of all-day or multi-day exposure to heat may not be captured in laboratory studies lasting only a few hours (Meade et al., 2024). Others question the realism of the subjects’ activities during highly controlled physiological studies in the laboratory. The objective of this study was to evaluate the impact of fan use on comfort and heat strain in a manufacturing environment in Baton Rouge, Louisiana, USA, with workers engaged in their typical work for the full day over several weeks.
2. Methods
2.1 Site
The study was conducted in two adjacent, non-air-conditioned steel manufacturing buildings in Baton Rouge, Louisiana, USA. Building 1: 3,300 m², 12 m high insulated ceiling; Building 2: 1,800 m², 8 m high uninsulated ceiling. Both buildings featured large openings for forklift access, allowing significant air exchange with the exterior environment. A variety of fans, including HVLS (high volume low speed) ceiling fans, wall fans and floor fans have been installed in both facilities.
We recruited a total of 36 volunteer subjects (34 male, 2 female, ages 18 to 57) out of approximately 60 total workers to participate in our study. Participants engaged in a variety of manufacturing activities during the study, including mechanical assembly, electrical work, welding, machining, grinding, etc. Neither activity level nor clothing was controlled during the study. Activity levels were estimated to be between 1.2 and 2.0 met with occasional higher metabolic levels. Clothing levels were estimated to range from 0.8 to 1.3 clo and often included protective equipment such as steel-toed boots, welding aprons, overalls and hard hats. Subjects worked four 10-hour daily shifts per week, typically from 5:30 a.m. to 4:30 p.m. with two 15-minute breaks and 45 minutes for lunch.
2.2 Experimental Protocol
The start and end of each experimental session were aligned with workers’ normal shift and meal schedules. A six-week non-randomized crossover study was conducted over two separate three-week periods to capture seasonal variation. The first period took place in late May, when conditions were typically warm but milder than late summer (median afternoon outdoor temperature 31.1°C, IQR 30.0–31.7°C), and the second period in early August, which was characterized by hotter weather (mean afternoon outdoor temperature 32.6°C, IQR 31.7–33.9°C). During the May period, fans were alternated on and off on a daily basis, whereas during the August period, fans were alternated on and off in AM/PM blocks. This August design enabled a more direct comparison between morning and afternoon conditions, as indoor temperatures were consistently higher in the afternoon. Note that several exhaust fans remained operational at all times, but these fans did not contribute significantly to air movement near workers.
2.3 Measurement
Air temperature and relative humidity were measured using iButton sensors (DS1923-F5; temperature accuracy ±0.5°C, relative humidity accuracy ±5% RH), and mean radiant temperature was measured using a ChaosSense ComfortCube (radiant temperature accuracy ±0.3°C), with iButton sensors deployed at multiple locations throughout both buildings. Air velocity was measured using an anemometer (Sensor Anemo series 5100LSF, air velocity accuracy ±0.02 m/s ±2% of readings) at several locations for each of the participants’ work areas prior to the start of the study under both fan-on and fan-off conditions. When the fans were operating, air velocity exhibited substantial spatial variability, ranging from approximately 0.2 m/s to over 4 m/s depending on location relative to the fans. Operative temperature was calculated based on measured air temperature and mean radiant temperature using the ISO 7730 simplified method assuming an air velocity of <0.2 m/s when fans were off and 1.5 m/s when fans were on. The distributions of air temperature, relative humidity, and operative temperature during the study period are summarized in Table 1.
For physiological measurements, sublingual temperature was measured using an electronic thermometer (Welch Allyn SureTemp Plus Model 690; accuracy ±0.1°C) as a proxy for core body temperature. Heart rate was recorded using a heart rate sensor (Polar H10), and sweat loss was also quantified. Sweat loss was calculated according to Eq. 1. It was estimated by weighing participants (with clothing) using a precision digital scale (GBK 300AM; readability: 0.02 kg) at the beginning and end of each experimental session, as well as before and after each restroom visit and before and after lunch. Fluid intake and food consumption during the experiment were also recorded.
Eq. 1: Sweat loss = Δmbody − mexcreta + mfood + mfluid − Δmclothing
Where Δmbody is the change in body mass between the start and the end of each session, mexcreta is the total mass excreted during restroom visits, mfood and mfluid are the total food and fluid intake mass, and Δmclothing accounts for moisture retained in clothing. Note that the change in clothing weight over the day was measured in the May period but not in the August period to simplify the protocol.
Table 1. Mean and standard deviation of indoor environmental conditions (air temperature, relative humidity, mean radiant temperature and operative temperature) during the two 3-week study periods.
| Measuring period | Session | Fan status | Tair (°C) median (IQR) | MRT (°C) median (IQR) | RH (%) median (IQR) | Top (°C) median (IQR) |
|---|---|---|---|---|---|---|
| May 19 – June 05 | AM | Off | 28.1 (26.5–29.9) | 30.3 (28.6–32.4) | 71 (64–76) | 30.6 (28.9–32.5) |
| AM | On | 27.8 (26.8–29.6) | 29.2 (28.1–31.2) | 73 (66–78) | 29.4 (28.1–31.5) | |
| PM | Off | 32.8 (31.9–34.1) | 35.6 (34.8–36.8) | 52 (47–57) | 35.4 (34.7–36.3) | |
| PM | On | 32.4 (31.6–33.1) | 35.1 (33.7–36.0) | 54 (50–57) | 34.9 (33.8–35.8) | |
| August 11 – August 28 | AM | Off | 30.9 (29.0–32.9) | 29.7 (27.4–31.5) | 64 (57–72) | 29.2 (27.0–31.0) |
| AM | On | 29.4 (27.8–32.0) | 28.3 (26.2–30.2) | 66 (60–70) | 28.0 (26.1–30.0) | |
| PM | Off | 35.3 (34.3–36.1) | 33.6 (32.8–34.4) | 49 (45–52) | 33.1 (32.4–33.7) | |
| PM | On | 34.9 (33.8–35.9) | 32.8 (31.6–33.5) | 50 (46–54) | 32.3 (31.4–33.1) |
Because the August experiment adopted a crossover design, sweat rate was used to ensure comparability across conditions. Sweat rate was defined as sweat loss per unit time and was calculated according to Eq. 2.
Eq. 2: Sweat rate = Sweat loss / Session duration
In addition to physiological measurements, subjective responses were collected using electronic questionnaires conducted three times per day during the May–June period (once in the AM session, twice in the PM session) and four times per day during the August period (twice per session). The questionnaires include thermal sensation, thermal acceptability, self-reported rating of perceived exertion (RPE), perceived productivity, air-movement preference, and perceived impact of heat on work performance. In addition, an exit survey was administered once at the end of each study period to capture participants’ overall experience across the three-week deployment.
2.4 Data Analysis
To quantify the relationship between indoor air temperature and subjective responses, while accounting for repeated measurements within individuals, linear mixed-effects models (LMMs) were employed. Models included random intercepts and random slopes, allowing inter-individual variability in baseline perception and temperature sensitivity. All analyses were conducted separately for fan-on and fan-off conditions. Outcome variables included thermal sensation, self-assessed level of effort, perceived productivity, and acceptability. The predictor variable was the indoor air temperature averaged over the 20 min preceding each vote. Prior to model fitting, indoor air temperature was grand-mean centered to improve interpretability of model coefficients, as Eq. 3.
Eq. 3: Tair,c = Tair − Tair
where Tair denotes the mean indoor air temperature across all observations, which was 31.8°C in this study.
Model explanatory power was quantified using the marginal R²m and conditional R²c for mixed-effects models. The R²m reflects variance explained by fixed effects alone, whereas the R²c reflects variance explained by both fixed and random effects, thereby distinguishing the contributions of environmental exposure and inter-individual differences.
Similarly, the relationship between sweat rate and indoor air temperature was examined with linear mixed-effects models fitted separately for fan-on and fan-off conditions. Based on likelihood-ratio tests, the inclusion of random slopes did not provide a statistically significant improvement in model fit; therefore, only random intercepts were retained for sweat-rate models.
For discrete subjective responses, including air movement preference and perceived negative impact of heat, temperature-dependent response distributions were analysed using a bin-based proportional approach. Indoor air temperature averaged over the preceding 20 min was discretized into 3°C bins. To avoid repeated counting of individual preferences within the same temperature range, multiple responses from the same participant under the same fan condition and temperature bin were averaged. The proportions of each response category were subsequently computed to characterize overall trends across temperature bins.
To evaluate the effect of fan operation on sweat response, paired-sample t-tests were conducted using each participant’s mean sweat rate under fan-on and fan-off conditions.
All statistical analyses were performed using R (version 4.5.1). Statistical significance was defined as *p-value < 0.05, **p-value < 0.01, and ***p-value < 0.001.
3. Results
3.1 Subjective Responses
Figure 2 illustrates the relationships between indoor air temperature and four subjective responses—thermal sensation, perceived level of exertion, self-reported work productivity, and thermal acceptability—under fan-on and fan-off conditions. Although the slopes of thermal sensation with respect to indoor temperature were nearly identical across the two fan states, thermal sensation votes were consistently higher under the fan-off condition, with an average difference of approximately 1 vote scale unit. Consistent with the thermal sensation results, self-reported level of exertion also exhibited sensitivity to both indoor temperature and fan operation. When fans are operating, participants generally reported lower perceived exertion than when fans are off, with an average difference of approximately 0.4 vote units between the two conditions. This finding suggests that the presence of air movement partially alleviates the subjective burden of work under hot conditions.
Because many of the work products are completed over multiple stages by multiple workers and require several days to finish, no reliable objective measure of individual productivity was available. Consequently, productivity analyses are based on self-reported assessments. Despite this limitation, the model results reveal differences between fan conditions. It is important to note that the marginal R² values of all models are relatively modest, whereas the conditional R²c values are substantially higher. This discrepancy indicates that, although temperature exerts a statistically significant influence on subjective responses, it explains a limited proportion of the total variance. In contrast, between-individual differences account for a large share of variability in perceived responses within the same environment. This outcome is not unexpected, as the analysis is based on field data collected in a real-world industrial setting, where clothing insulation, actual work intensity, and individual adaptation states were not experimentally controlled. While these uncontrolled factors may lead to substantial differences in baseline perception across workers, the response slopes to temperature remain consistent across most participants, as shown in Figure 2.
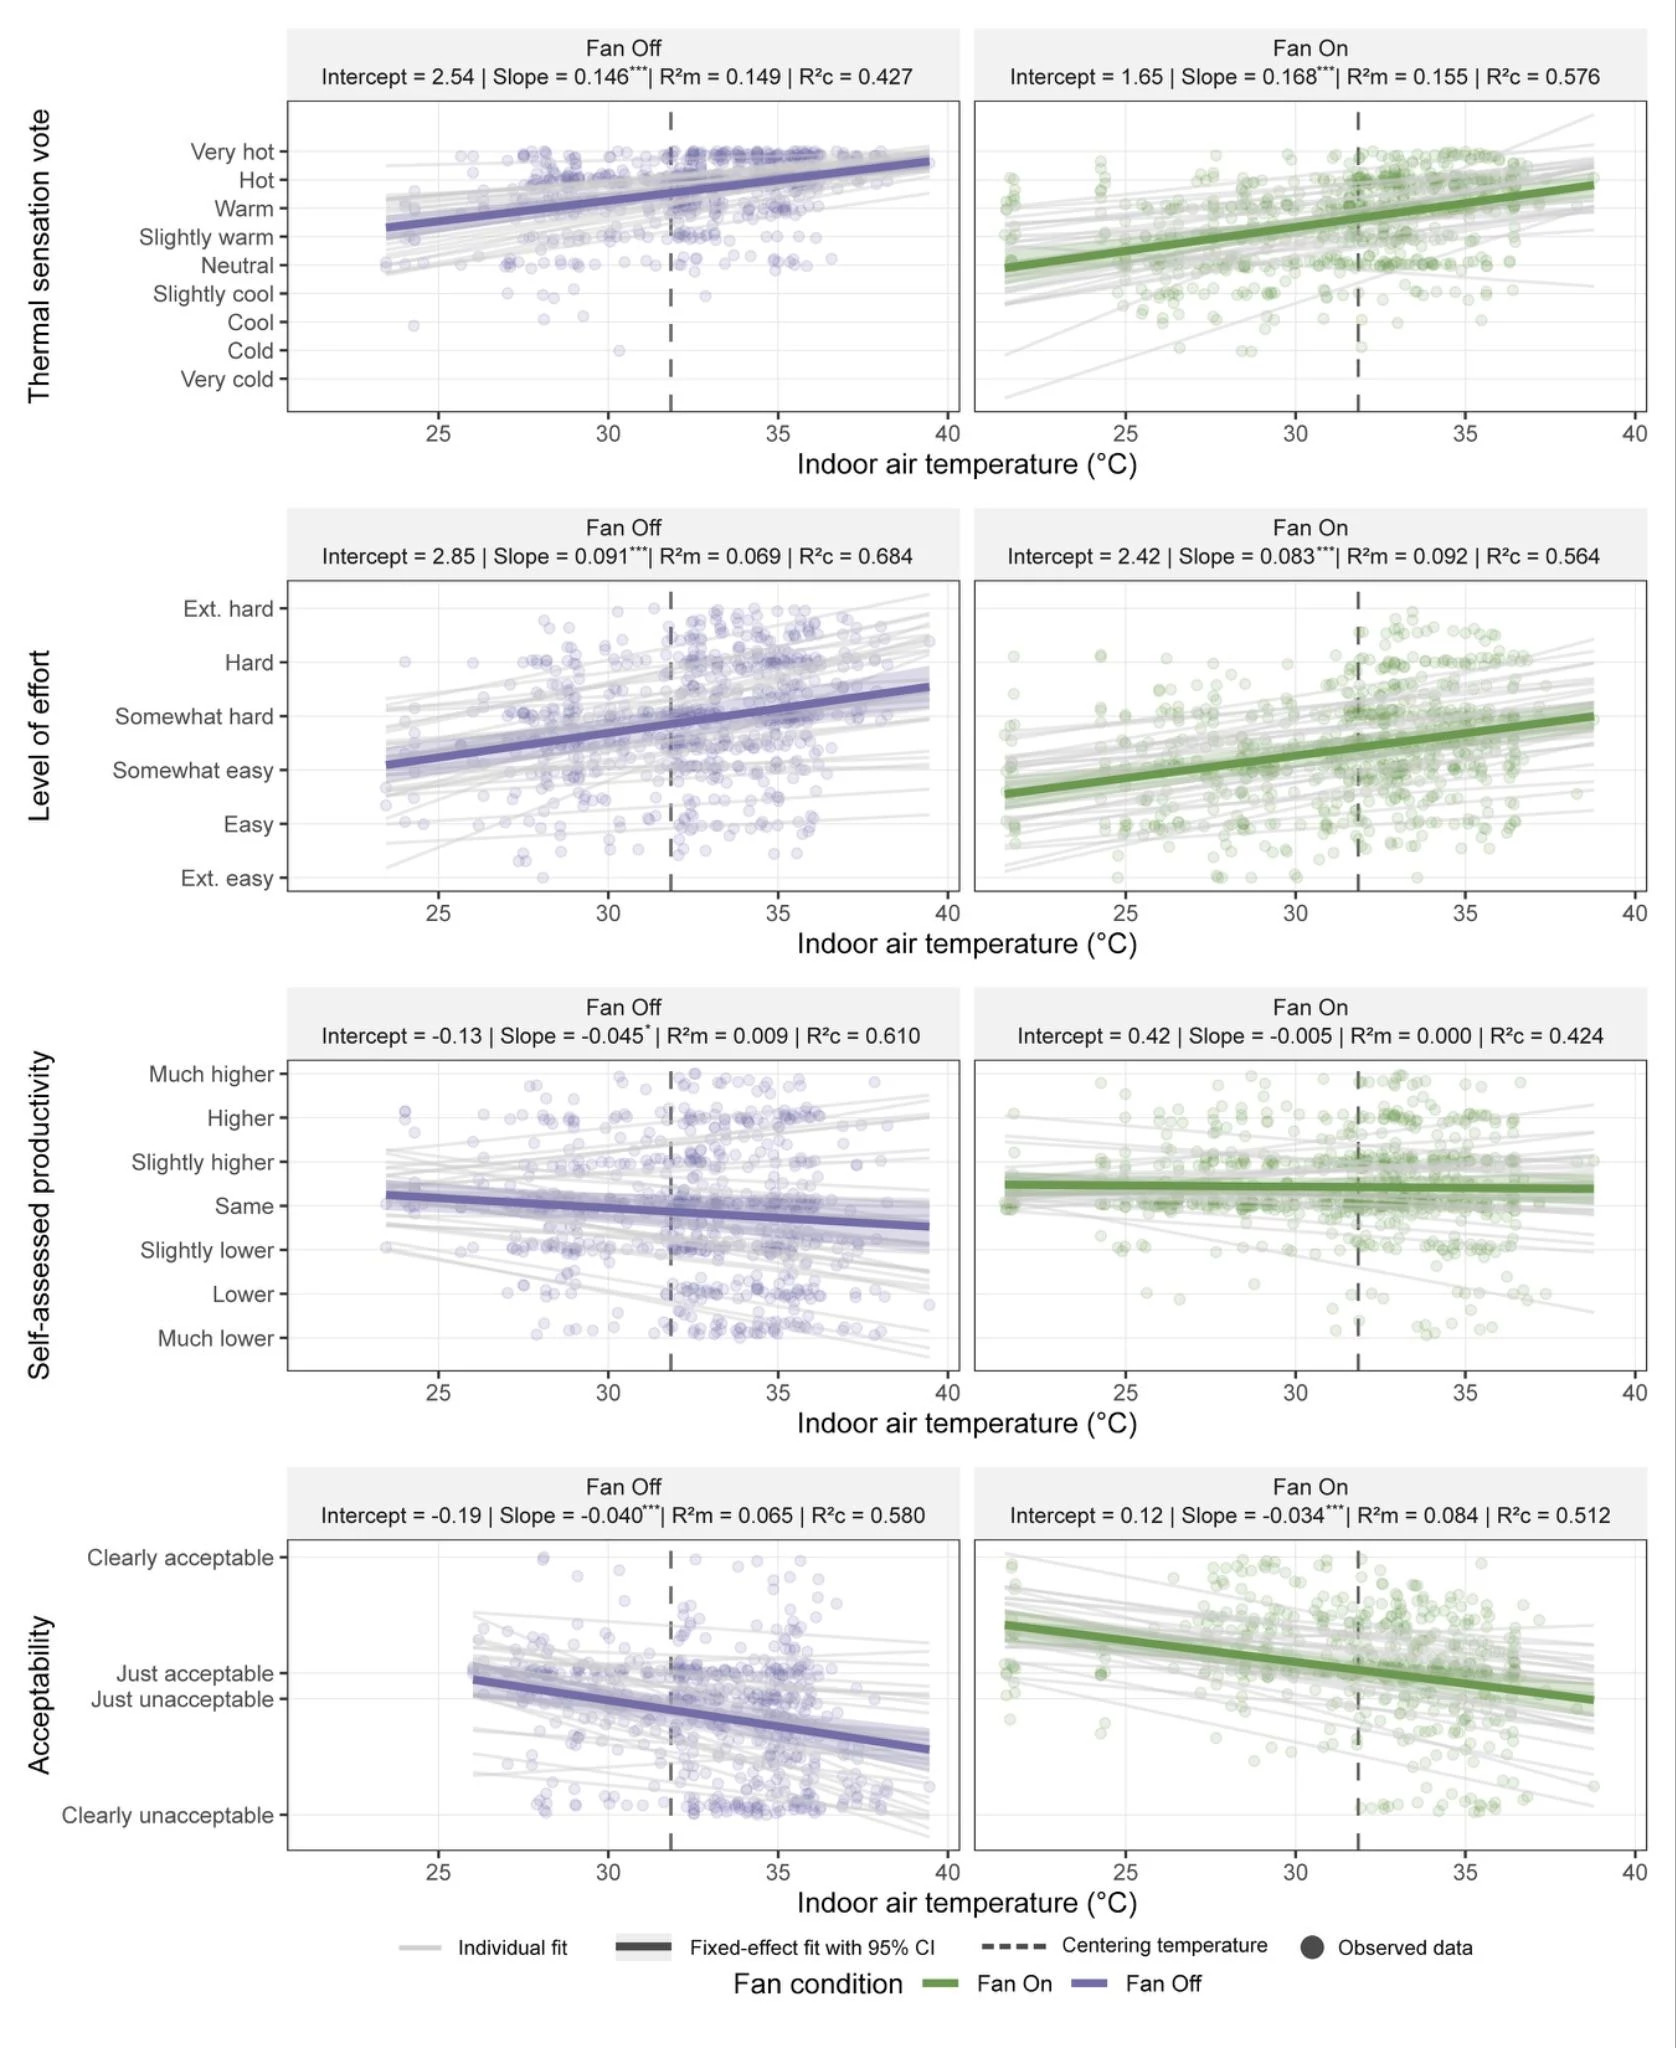
Figure 2. Relationships between indoor air temperature and four subjective responses under fan-on and fan-off conditions, including thermal sensation, perceived level of effort, self-reported productivity, and thermal acceptability.
The voting results for perceived heat-related negative impact and airflow preference are presented in Figure 3. As indoor air temperature increases, participants show a clear and consistent shift toward a preference for higher air movement, a trend that is particularly pronounced under the fan-off condition. When fans are not operating and temperatures exceed approximately 25°C, the majority of participants express a desire for “a little more” or “a lot more” airflow. In contrast, under the fan-on condition, the proportion of participants indicating “no change” in airflow preference increases, suggesting that the presence of air movement partially satisfies occupants’ needs at moderate temperatures. At temperatures above 31°C, most participants again report a desire for “a little more” or “a lot more” airflow independent of fan operation. This indicates that even when fans are operating, occupants maintain a strong demand for additional air movement under hot working conditions.
The analysis of perceived heat-related negative impact further shows that participants were increasingly likely to report that heat made it more difficult to work effectively as indoor temperature rose. At comparable temperature levels, participants under the fan-on condition reported lower levels of agreement with the statement that heat negatively affected their ability to work than those under the fan-off condition. When fans were off, increasing indoor temperature was associated with a pronounced shift toward “agree” and “strongly agree” responses, particularly in the moderate and high temperature ranges (≥28°C). By contrast, when fans were operating, the distribution of responses shifted toward “neutral” and “slightly disagree” even within the same high-temperature intervals.
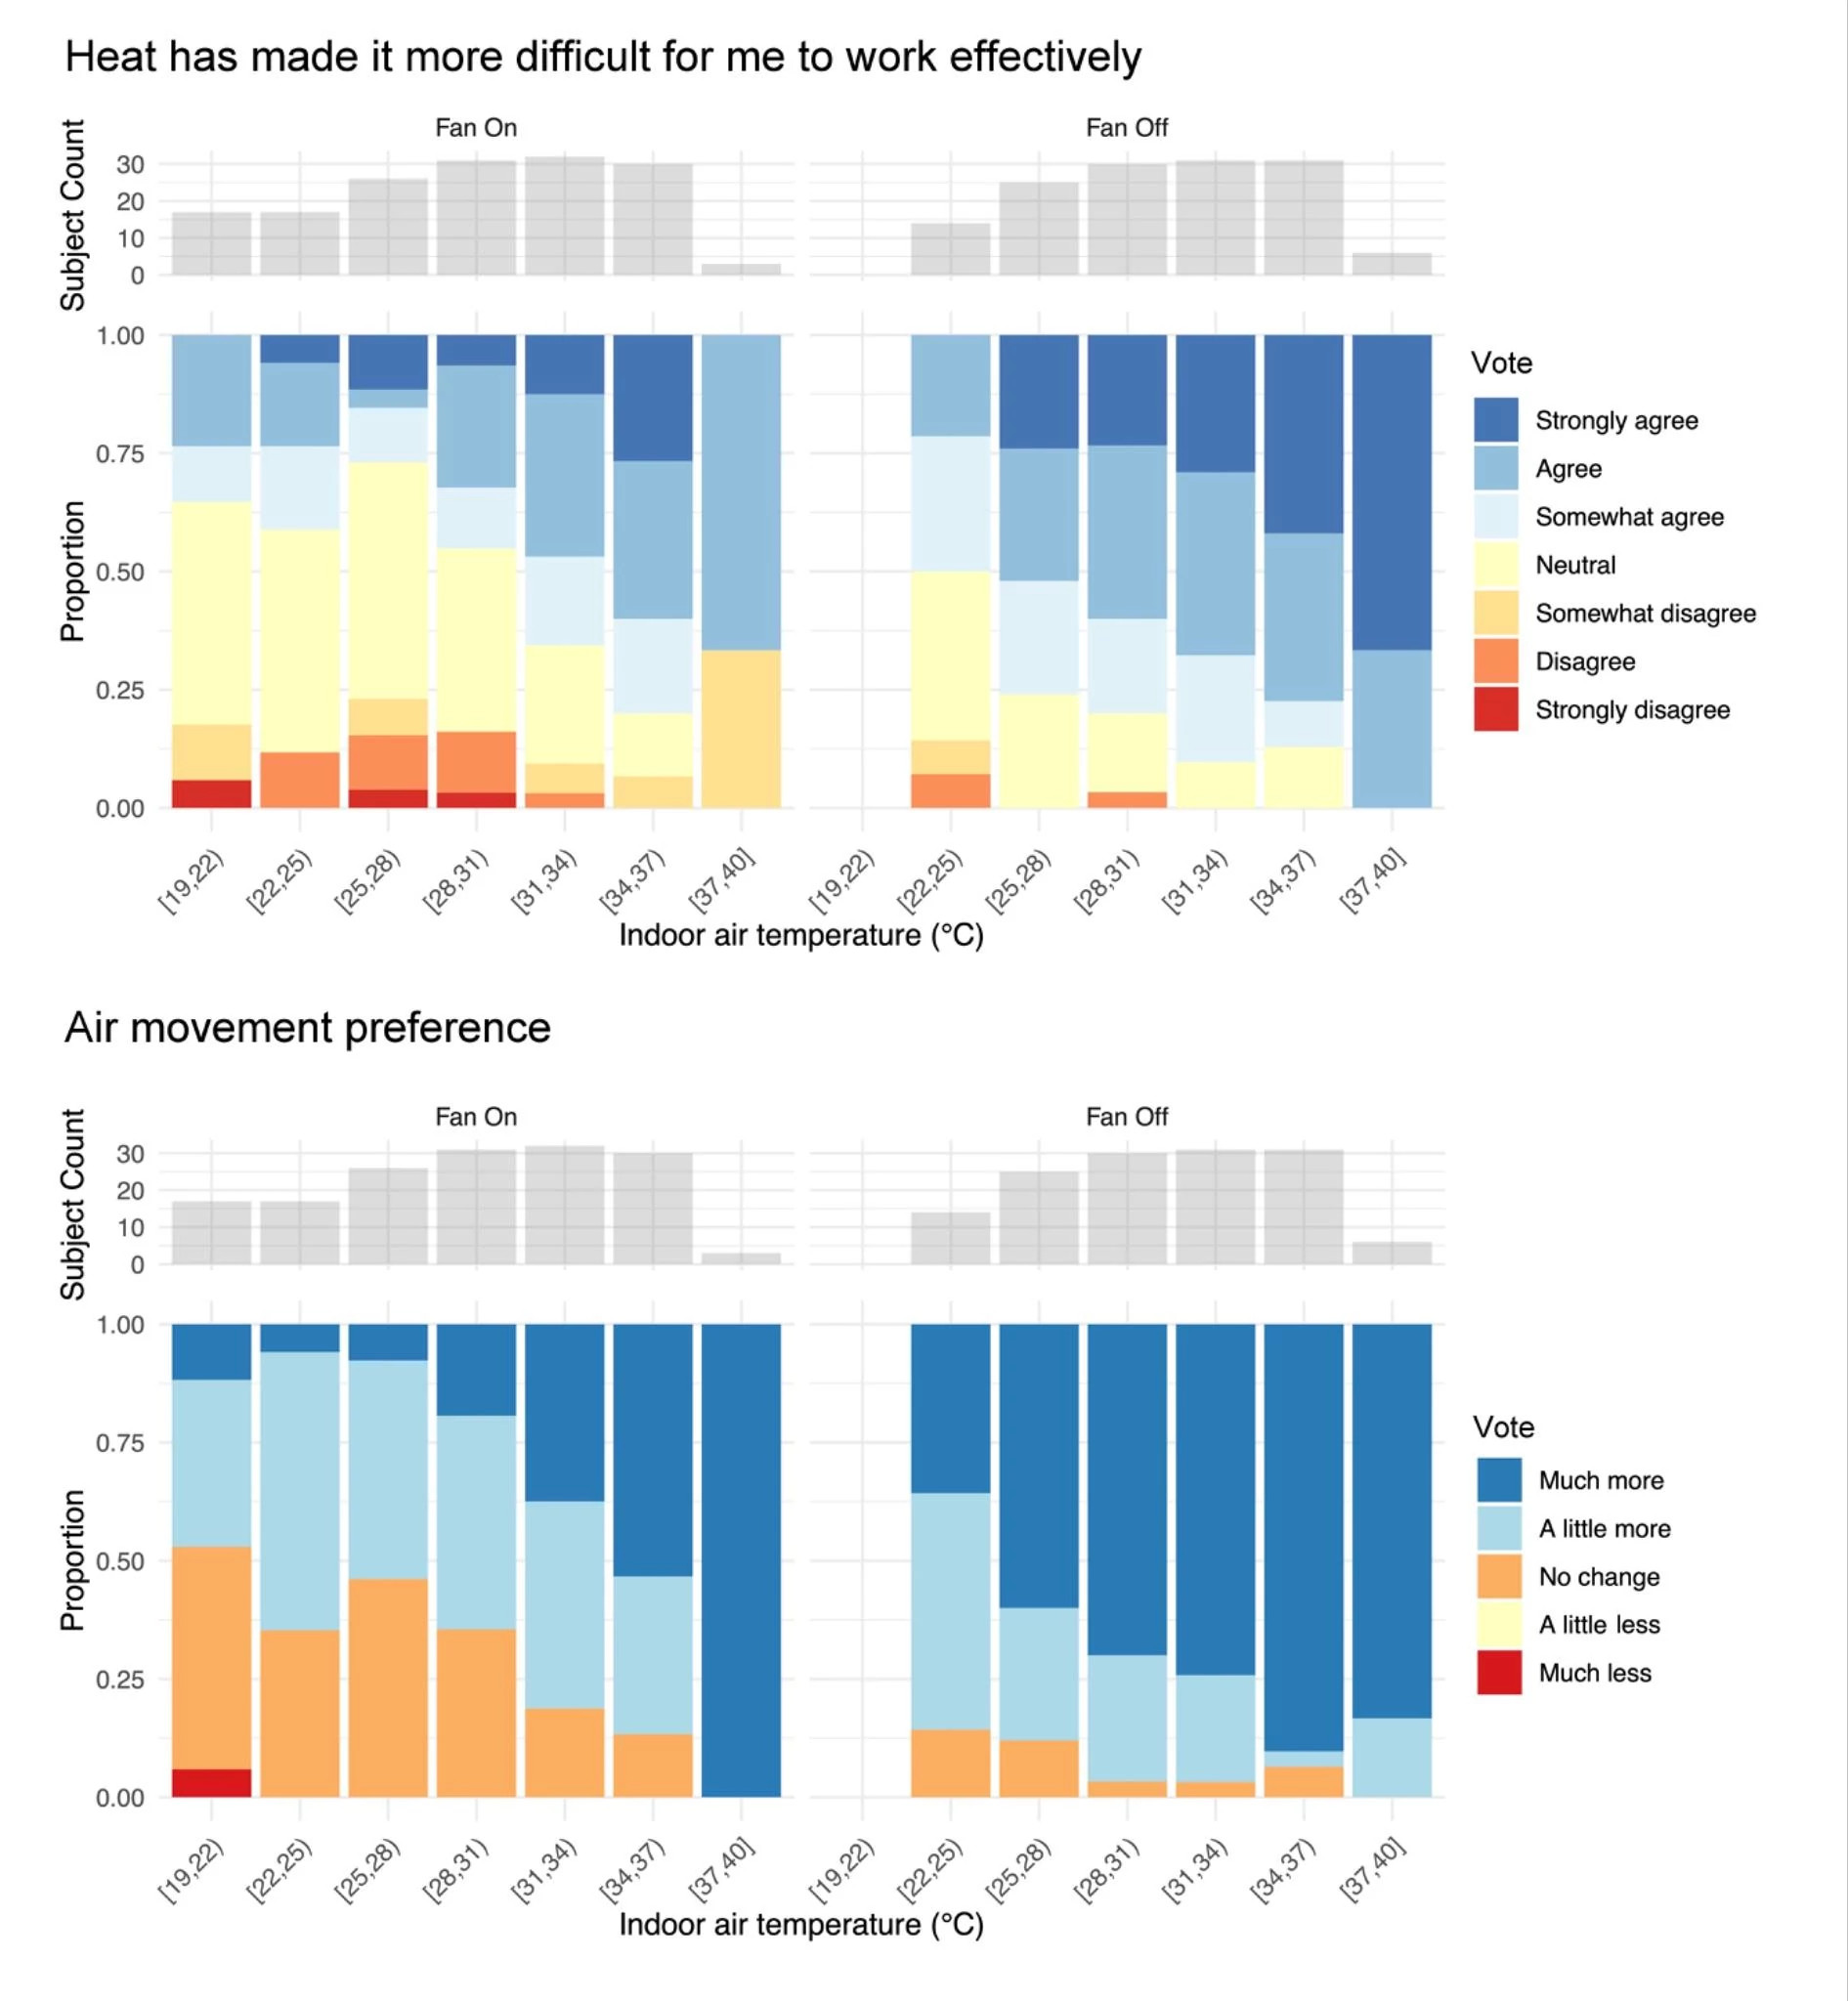
Figure 3. Relationships between indoor air temperature and (a) perceived negative impact of heat on work effectiveness and (b) airflow preference under fan-on and fan-off conditions.
3.2 Exit Survey
The exit survey results showed overwhelming positive support for the use of fans. Figure 4a shows that having fans in the workplace was important to all participants (89% “strongly agree”, 11% “agree”, no other votes). Figure 4b shows that 79% of respondents felt that they were more effective at their job with the fans running.
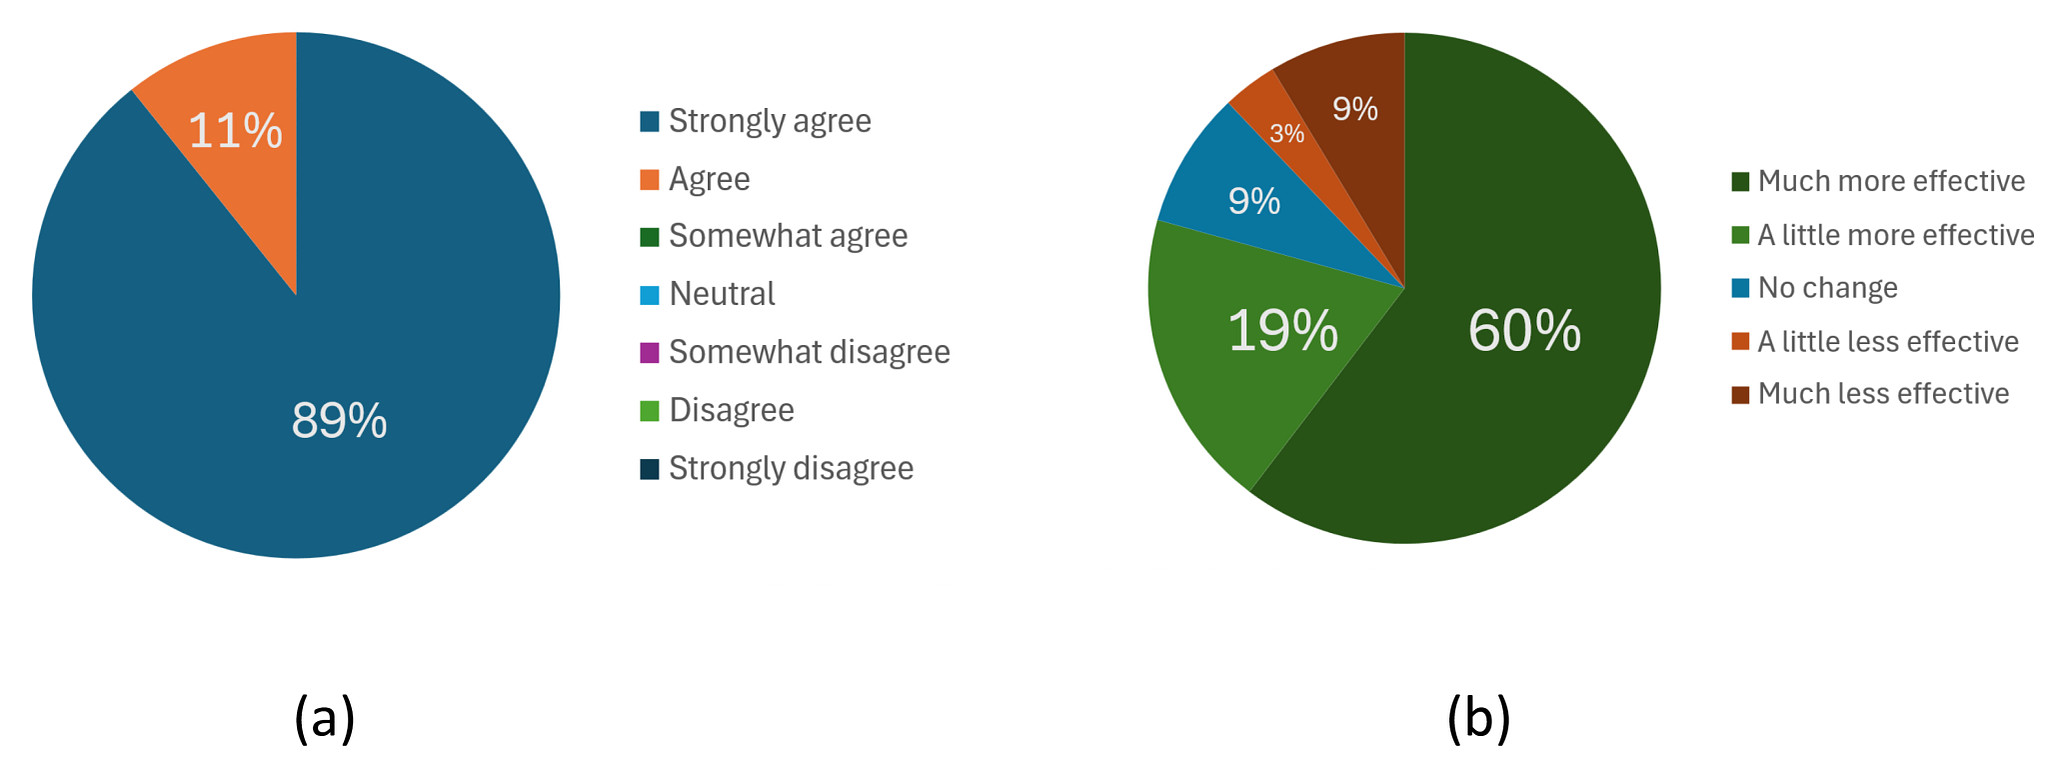
Figure 4. Exit survey responses to (a) “It is important to me to have the fans running in my workplace”; (b) “Compared to when the fans were turned off, when the fans were turned ON, how effective were you at your job?” (n=29).
3.3 Sublingual Temperature
A paired t-test was conducted to examine the effect of fan operation on sublingual temperature, as shown in Figure 5. For May and June, sublingual temperature did not differ between fan-on and fan-off conditions (mean difference = −0.037°C, 95% CI = [−0.109, 0.035], t(18) = −1.09, p = 0.290). For August, no significant fan effect was observed in either the morning (mean difference = +0.046°C, 95% CI = [−0.085, 0.177], t(14) = 0.76, p = 0.460) or the afternoon (mean difference = −0.228°C, 95% CI = [−0.514, 0.057], t(13) = −1.73, p = 0.108). In contrast, a clear time-of-day pattern emerged in August: under fan-off, sublingual temperature was higher in the afternoon than in the morning (mean difference = +0.257°C, 95% CI = [0.051, 0.463], t(14) = 2.68, p = 0.018, Cohen’s d = 0.692), whereas no AM–PM difference was detected under fan-on. Overall, these results indicate that fan operation did not have a statistically significant effect on sublingual temperature.
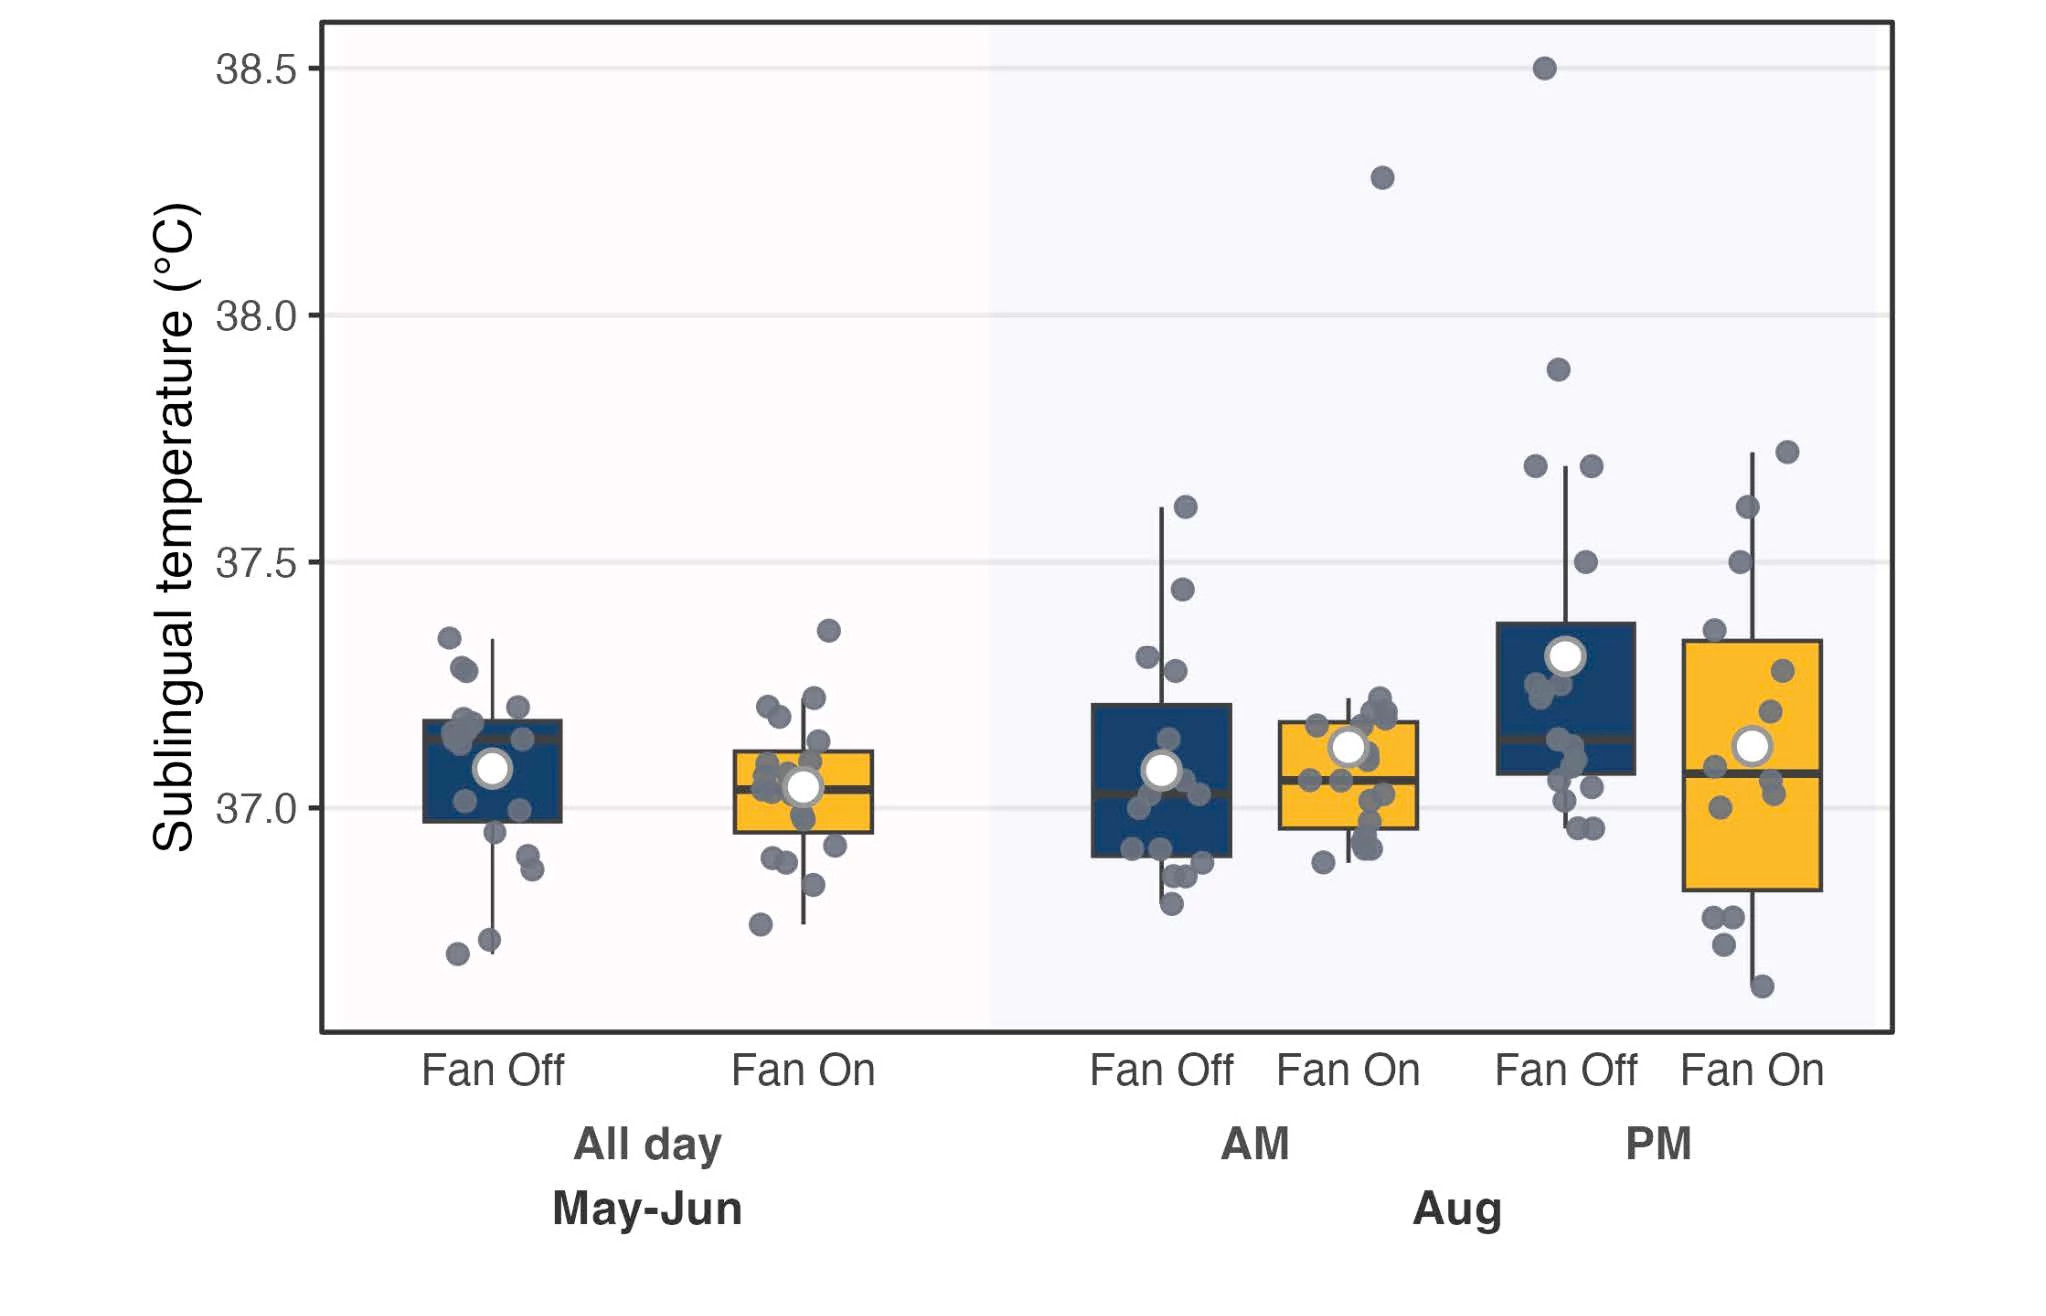
Figure 5. Sublingual temperature for AM and PM sessions segregated by fan condition.
3.4 Heart Rate
A paired t-test was conducted to examine the effect of fan operation on heart rate, as shown in Figure 6. For May and June, heart rate did not differ between the fan-on and fan-off conditions (mean difference = −1.16 bpm, 95% CI [−2.81, 0.50], t(18) = −1.47, p = 0.160). For August, fan effects were also not significant in either the morning (mean difference = 2.25 bpm, 95% CI [−0.30, 4.81], t(19) = 1.84, p = 0.081) or the afternoon (mean difference = −0.56 bpm, 95% CI [−3.17, 2.06], t(18) = −0.45, p = 0.660). Overall, these results indicate that fan operation was not associated with a significant change in heart rate. In contrast, a significant AM–PM difference was observed in August, with higher heart rate values in the afternoon than in the morning under both fan conditions. Under the fan-off condition, mean heart rate increased from 94.56 bpm in the morning to 101.95 bpm in the afternoon (95% CI [4.47, 10.31], t(19) = 5.29, p < 0.001, Cohen’s dz = 1.184). Under the fan-on condition, mean heart rate increased from 95.74 bpm in the morning to 100.34 bpm in the afternoon (95% CI [1.55, 7.66], t(18) = 3.16, p = 0.005, Cohen’s dz = 0.726).
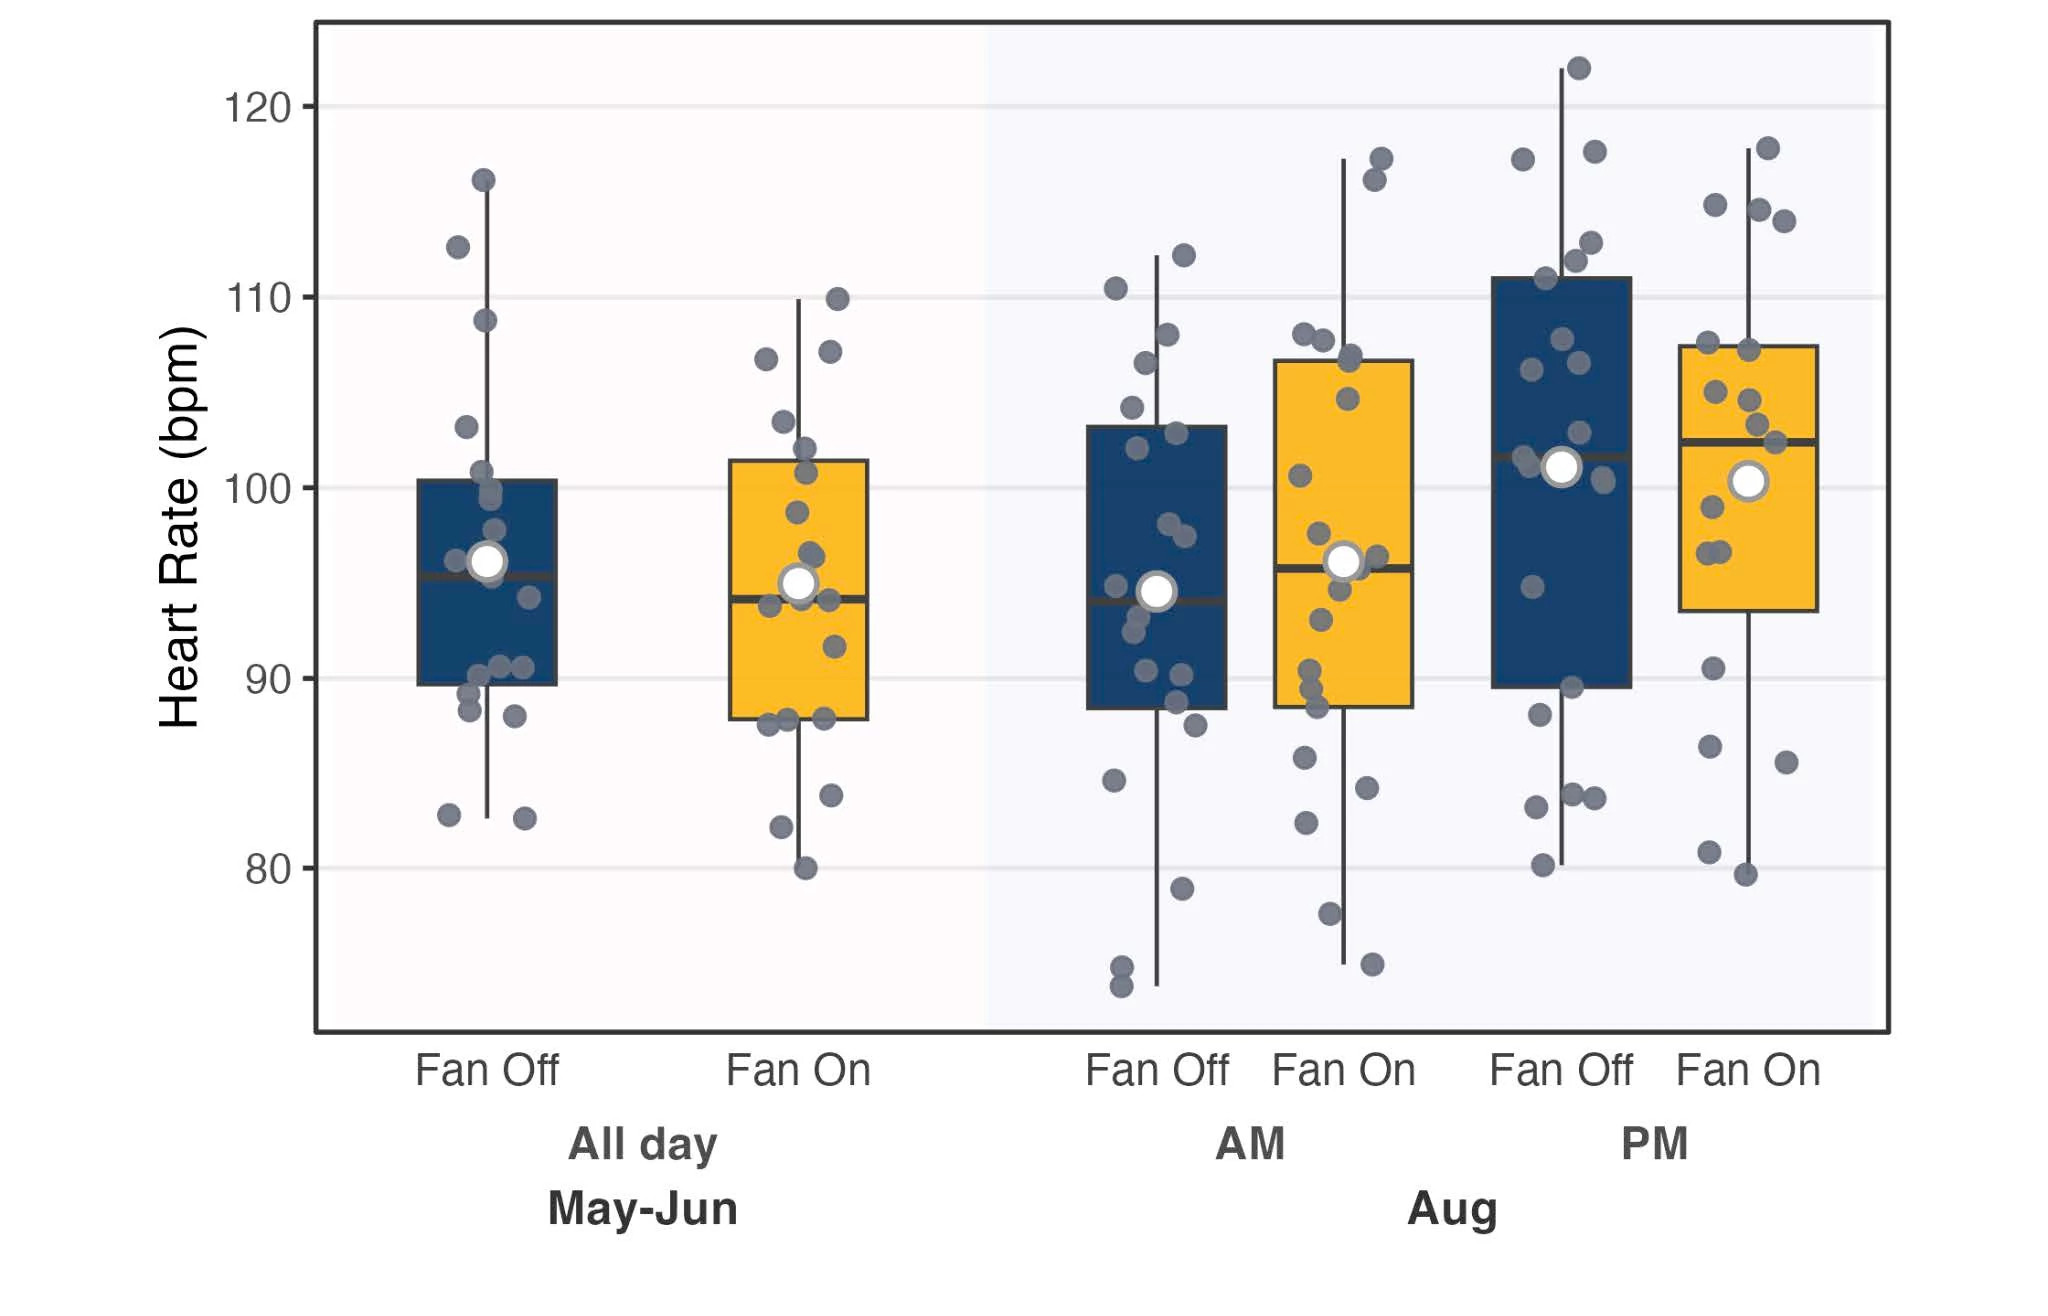
Figure 6. Heart rate data by AM/PM sessions and fan operation.
Figure 7 presents air temperature–heart rate pairs across the study period. In both fan-off and fan-on conditions, heart rate increased significantly with air temperature. Under fan-off, the estimated slope was 0.8 bpm/°C (p < 0.001), whereas under fan-on the slope was 0.7 bpm/°C (p < 0.001), indicating a robust positive temperature–HR association under both fan states with only modest differences in slope. This indicates a robust temperature–HR gradient in both fan conditions, consistent with increased cardiovascular strain as thermal load rises.
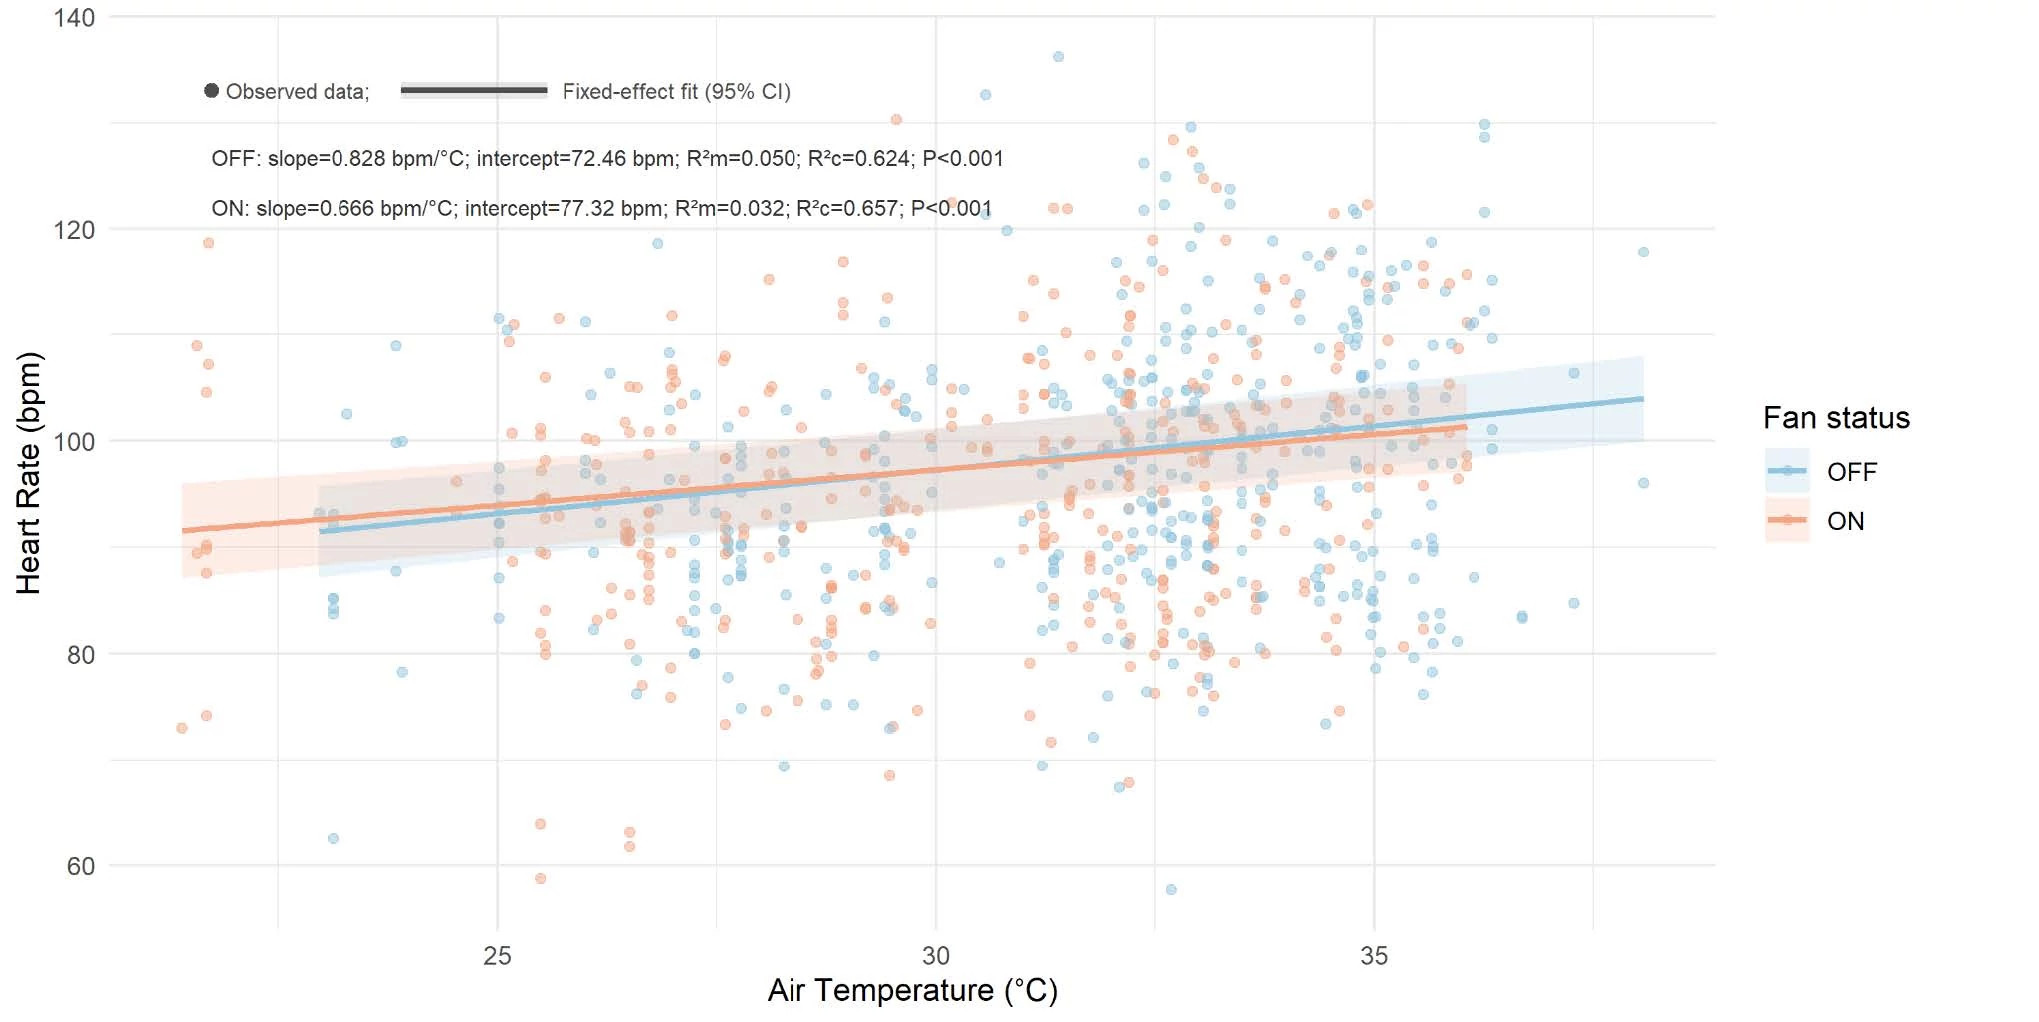
Figure 7. Heart rate as a function of indoor temperature for fan-on and off conditions.
3.5 Sweat Rate
A paired t-test was conducted to examine the effect of fan operation on sweat rate, as shown in Figure 8. For May and June, sweat rate was significantly lower under the fan-on condition than under the fan-off condition (mean difference = −0.029, 95% CI = [−0.051, −0.008], t(17) = −2.87, p = 0.011, Cohen’s d = 0.678), indicating that fan operation was associated with reduced sweat rate. For August, time-of-day–specific analyses revealed a different pattern. In the morning, the sweat rate was again significantly lower when fans were operating (mean difference = −0.038, 95% CI = [−0.067, −0.009], t(21) = −2.72, p = 0.013, Cohen’s d = 0.579). In contrast, no significant difference in sweat rate between fan-on and fan-off conditions was observed in the afternoon (mean difference = −0.003, 95% CI = [−0.045, 0.038], t(21) = −0.17, p = 0.868).
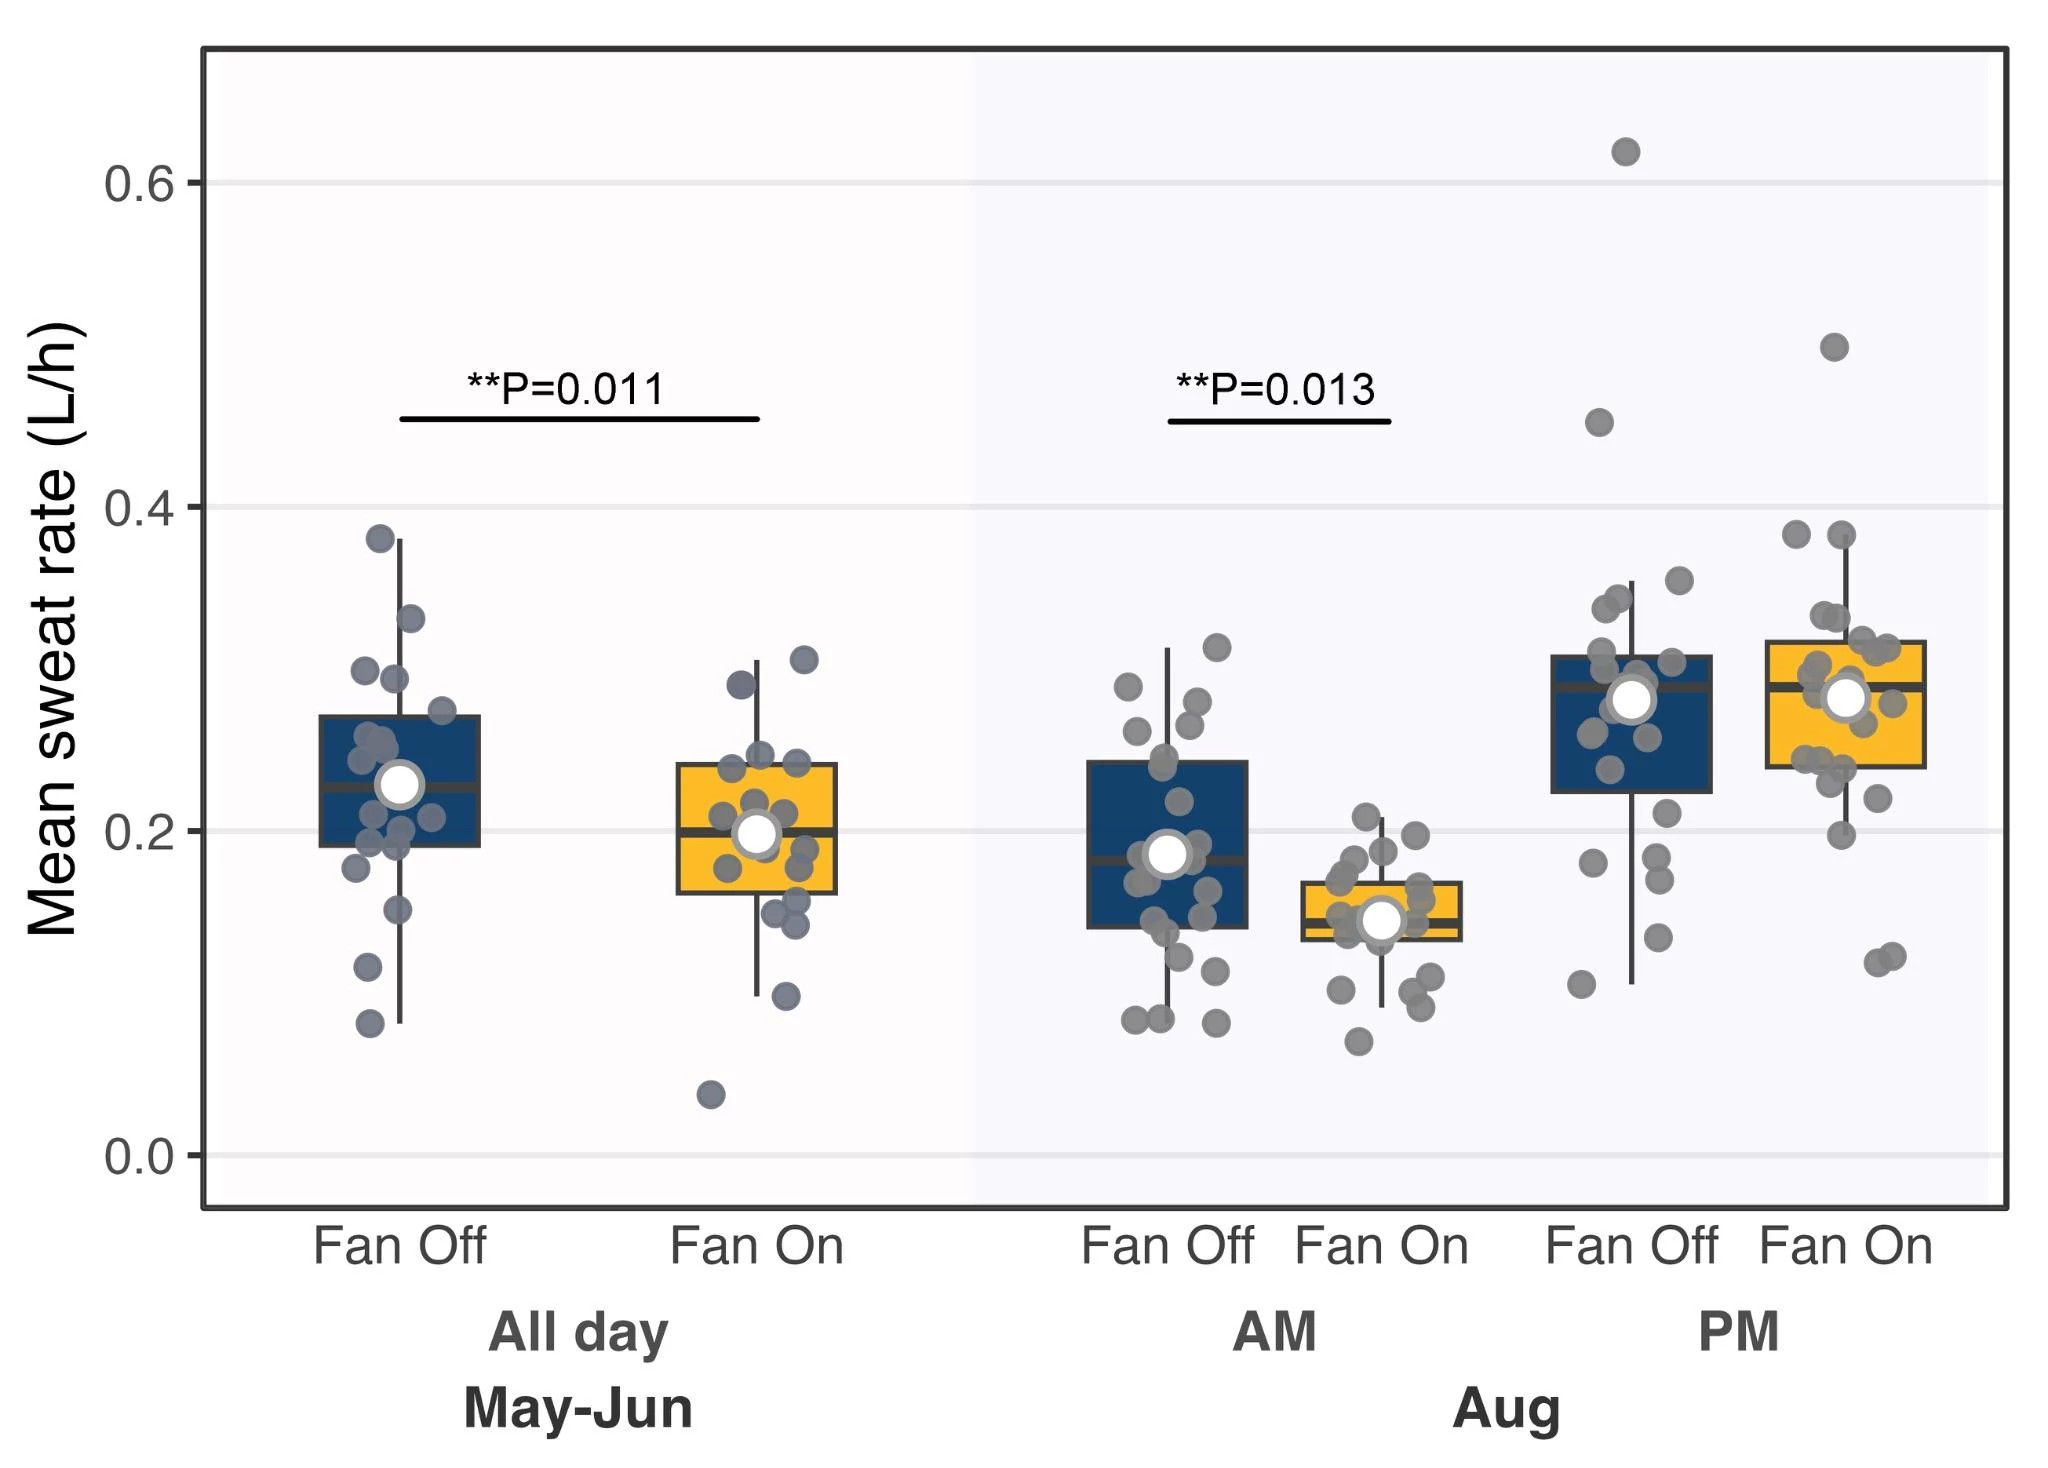
Figure 8. Sweat rate of workers under fan-on and fan-off conditions for (a) May–June and (b) August.
Figure 9 presents all recorded pairs of indoor air temperature and sweat rate across the study period. Separate random-intercept linear mixed-effects models were fitted for fan-off and fan-on conditions to further characterize the temperature–sweat rate relationship. In both conditions, sweat rate increased significantly with indoor air temperature. The slope was similar for the fan-off (0.017) and fan-on (0.021) conditions.
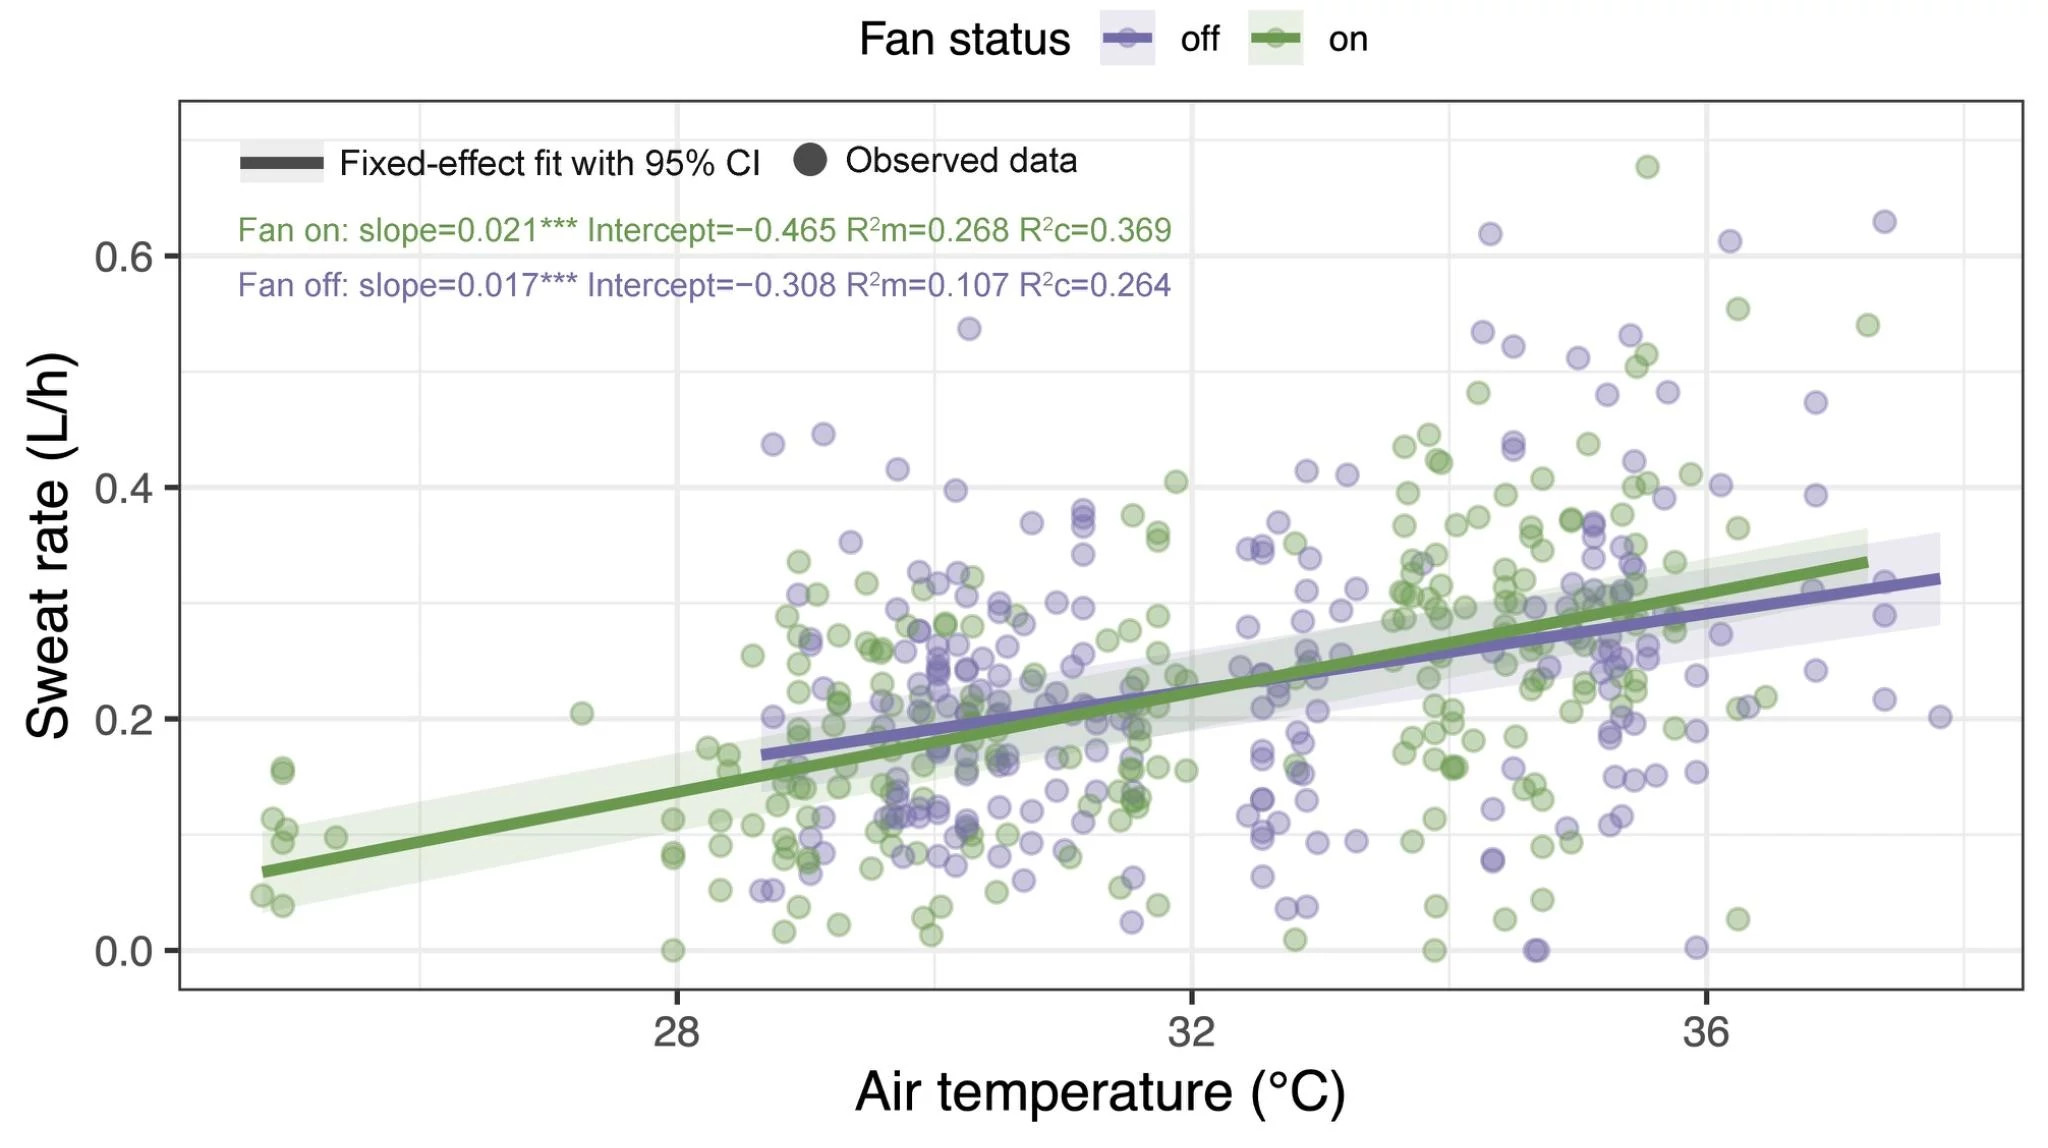
Figure 9. Sweat rate as a function of indoor air temperature.
4. Discussion
The survey results show clear perceived benefits of the use of fans to improve the thermal environment of workers. All participants highly valued the use of fans in their workspace and only rarely preferred less air motion.
Thermal sensation was significantly reduced by the use of fans. By comparing the regressions for fan-on and off conditions, we can estimate the overall average cooling effect to be 5.7°C. The self-perceived level of exertion data shows an average cooling effect of 5.0°C. Using the CBE Thermal Comfort Tool (Tartarini et al., 2020) we calculated a 5.8°C cooling effect based on an air velocity of 1.5 m/s (a subjective estimate of average air velocity), Top = 32°C, met = 1.8, clo = 1.0, RH = 50%, a very close match to both sets of subjective data.
Both air temperature and mean radiant temperature impact thermal stress on the body. These two environmental parameters are often combined into the single parameter operative temperature. In the buildings we studied, mean radiant temperature was often higher than air temperature, particularly in the afternoon due to solar gain on the roof and outside walls. In still air conditions, operative temperature is typically calculated by equally weighting air temperature and mean radiant temperature. As air speeds increase, air temperature is more heavily weighted to reflect the increase in the convective heat transfer coefficient between the body and the environment. Increased air speed therefore can mitigate the additional heat load of high radiant surface temperatures by increasing the heat transfer between the body and surrounding air (ASHRAE Standard 55, 2023).
Despite the challenges of collecting physiological data in a working manufacturing environment, the data show clear responses to the environmental conditions. Sublingual temperature, heart rate and sweat loss both increased with temperature. At cooler temperatures, fans reduce sweating by increasing convective cooling and lowering overall heat load on the body. At higher temperatures, fans did not reduce sweat rate but likely provided increased evaporative heat loss for the same amount of sweating (i.e., increased sweating efficiency). Heart rate and sublingual temperature were not impacted by the use of fans and were likely dominated by activity level and the rate of metabolic heat production rather than thermal stress.
5. Acknowledgments
This research has been supported by a gift from Big Ass Fans and by the Center for the Built Environment (CBE), University of California Berkeley (USA). The authors would like to thank the volunteers in the study for their participation. ChaosSense generously provided mean radiant temperature sensors.
6. References
- ASHRAE. Thermal environmental conditions for human occupancy (ANSI/ASHRAE Standard 55-2023). (2023). American Society of Heating, Refrigerating and Air-Conditioning Engineers.
- CDC US. Frequently Asked Questions (FAQ) About Extreme Heat. (2012). https://www.cdc.gov/disasters/extremeheat/faq.html (accessed March 23, 2023).
- EPA – United States Environmental Protection Agency. Extreme heat and indoor air quality. (2025). https://www.epa.gov/emergencies-iaq/extreme-heat-and-indoor-air-quality
- Jay, O., A. Capon, P. Berry, C. Broderick, R. de Dear, G. Havenith, Y. Honda, R.S. Kovats, W. Ma, A. Malik, N.B. Morris, L. Nybo, S.I. Seneviratne, J. Vanos, K.L. Ebi. Reducing the health effects of hot weather and heat extremes: from personal cooling strategies to green cities. The Lancet. 398 (2021) 709–724. https://doi.org/10.1016/S0140-6736(21)01209-5
- Meade, R.D., S.R. Notley, N.V. Kirby, G.P. Kenny. A critical review of the effectiveness of electric fans as a personal cooling intervention in hot weather and heatwaves. Lancet Planet Health 8 (2024) e256–e269. https://doi.org/10.1016/S2542-5196(24)00030-5
- Mihalcin, Emily, Stefano Schiavon, and Nicholas Ravanelli. 2025. “Examining the Physiological Strain with Electric Fans During High Indoor Heat Stress.” Building and Environment, June 4, 113261. https://doi.org/10.1016/j.buildenv.2025.113261
- Morris, N.B., T. English, L. Hospers, A. Capon, O. Jay. The Effects of Electric Fan Use Under Differing Resting Heat Index Conditions: A Clinical Trial. Ann. Intern. Med. 171 (2019) 675–677. https://doi.org/10.7326/M19-0512
- OSHA Technical Manual (OTM), Section III: Chapter 4, Heat Stress. (Updated 2017/2022).
- Ravanelli, N.M., S.G. Hodder, G. Havenith, O. Jay. Heart Rate and Body Temperature Responses to Extreme Heat and Humidity With and Without Electric Fans. JAMA. 313 (2015) 724–725. https://doi.org/10.1001/jama.2015.153
- Smallcombe, J., Jay, O., et al. (2025). “Low-cost cooling strategies to maintain productivity and health in the garment sector.” The Lancet Planetary Health.
- Tartarini, F., Schiavon, S., Cheung, T., & Hoyt, T. CBE Thermal Comfort Tool: Online tool for thermal comfort calculations and visualizations. SoftwareX, 12 (2020): 100563. https://doi.org/10.1016/j.softx.2020.100563 · comfort.cbe.berkeley.edu
- Tartarini, F., S. Schiavon, O. Jay, E. Arens, C. Huizenga. Application of Gagge’s energy balance model to determine humidity-dependent temperature thresholds for healthy adults using electric fans during heatwaves. Build. Environ. 207 (2022) 108437. https://doi.org/10.1016/j.buildenv.2021.108437
- UK Health Security Agency. Supporting vulnerable people before and during hot weather. (2024). London: GOV.UK. https://www.gov.uk/guidance/supporting-vulnerable-people-before-and-during-hot-weather-social-care-managers
- World Health Organization (WHO). Heat and health. (2024). https://www.who.int/news-room/fact-sheets/detail/climate-change-heat-and-health (accessed June 25, 2025).


